
Something happened over the last few days. Things became more clear and I’m excited to share what I created. It has been in process for a long time but playing with layering colour dial discs to make red, green and blue opened up some new realizations. I saw that there are two magenta discs needed to make red and blue. The fact there were two triggered my brain to see something of the bigger picture. A voice in my head kept telling me to keep going. There is more. Keep going. Since my brain seems to work better when my hands are busy, I decided to do the dishes. Numbers and colours began to arrange themselves in my mind while I was scrubbing. After playing with some red, green and blue flashlights and the colour dials, I started to draw diagrams. Colour math. It all came together and made so much sense. Why haven’t I seen diagrams like these before?
I jumped into Illustrator to create these two diagrams based on my drawings.
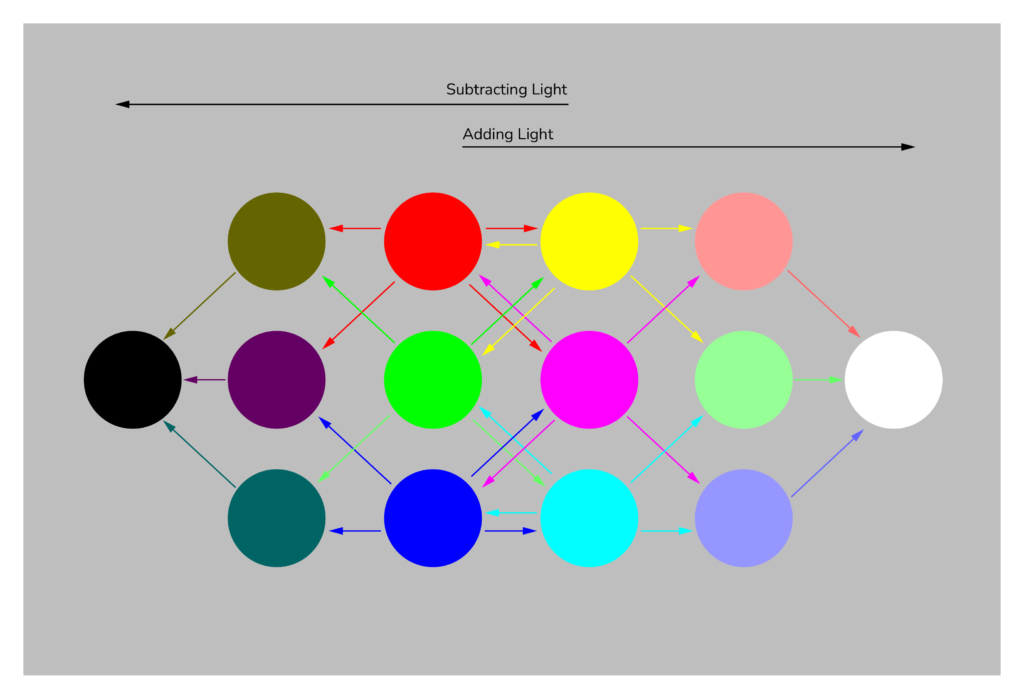
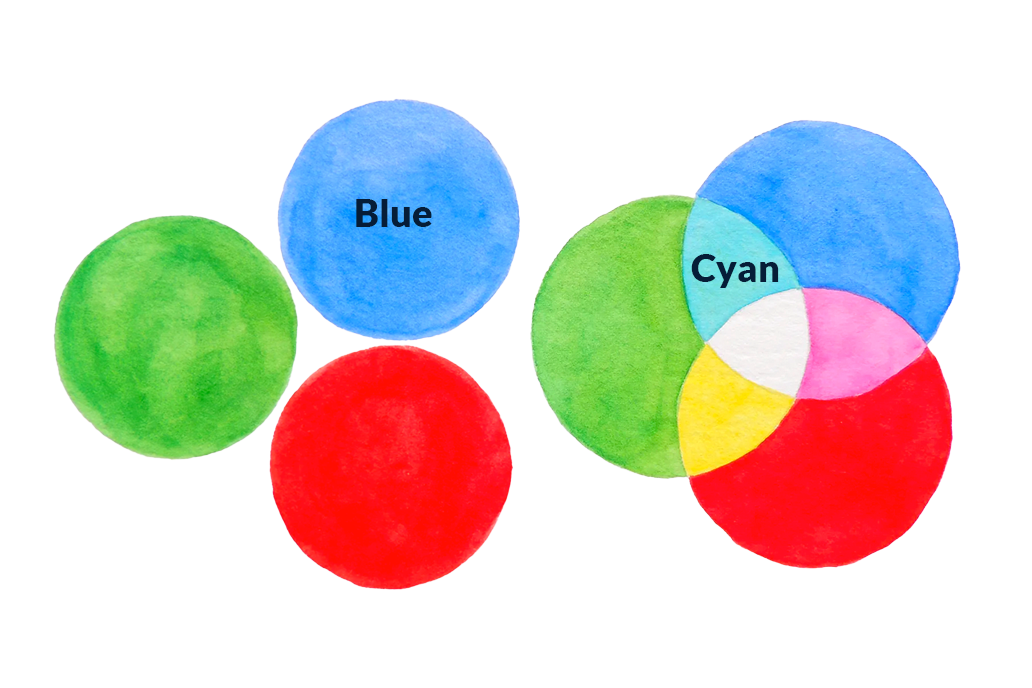
Unlike the Venn diagrams that show colours mixing, these capture the motion involved in colour perception. Our experience of colour is not static. It is full of motion and action. Light waves are interacting with our eyes. I think the Venn diagrams were created to illustrate red, green and blue flashlight beams overlapping. They show us what happens when you mix light but do not illustrate the RGB/CMY pattern that occurs along the value (dark to light) spectrum.
If you look at the diagram with the arrows, you can see it is possible for the colour mixing to go either direction. However, since human eyes generally have three types of photoreceptor cells, L-cones detect long wavelengths (red), M-cones detect medium wavelengths (green), and S-cones detect short wavelengths (blue), it makes sense to start at RGB when adding light. RGB can create cyan, magenta and yellow. These are lighter valued colours than RGB because light is being added in order to create them. This is why we need to create materials that start with CMY to mix with because when mixing materials, we are subtracting light. If we started with RGB as primary colours for mixing materials, we wouldn’t be able to find the vivid cyan, magenta and yellow needed to create a larger gamut of coloured materials.
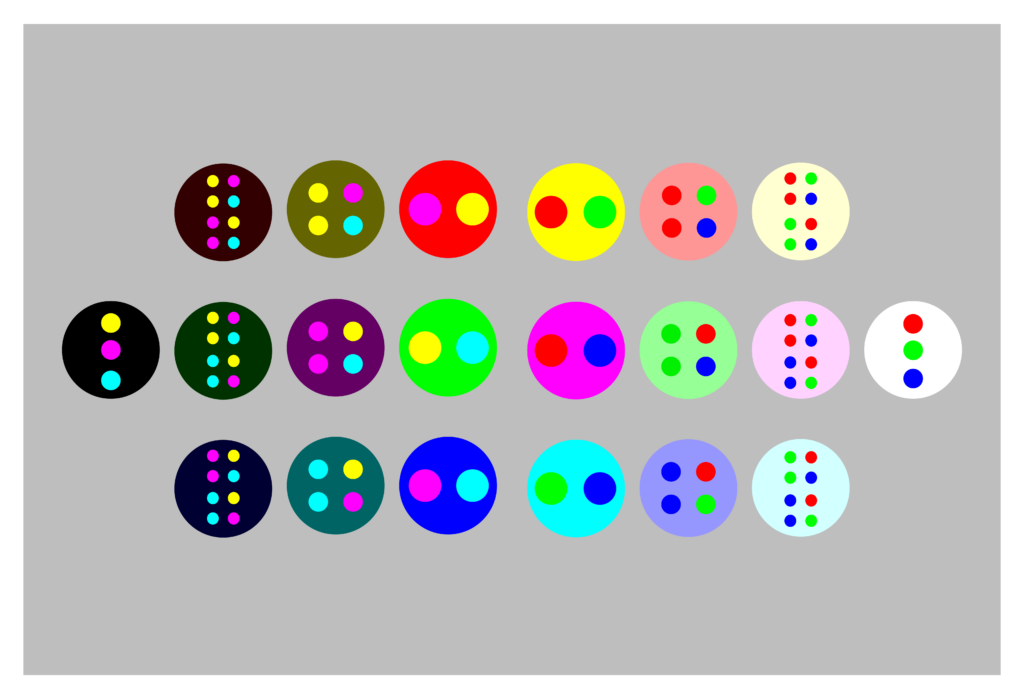
The diagram with the little circles allows you to see how much of each colour is involved in the larger circle. The reason we see certain colours is because they make up the majority of the overall colour. This is a simplified explanation because light waves are reflecting and being absorbed but it allows us to access the concepts through illustration.
There is so much work to do to help people understand colour but hopefully these diagrams will do some of the heavy lifting.
Thank you so much for your interest and curiosity.